Experience Intimacy Benchmark 2026 · For outdoor, sports and performance brands

Your brand goes dark at checkout. See what closing that gap is worth.

Your CRM, CDP and ecommerce data stop at the purchase. See how you compare with competing brands on what happens next, and what it's worth in revenue.

22 questions
10 minutes
Report in one business day
Get my benchmark report
Closes Nov 24, 2026

Benchmarked against 10 outdoor, sports and performance brands and more than 250,000 customers who connect their wearables and apps.

Why now

The next purchase is decided before your customer reaches your site.

Shoppers are handing product research and comparison to AI agents, and those agents can already see what customers bought. The brands that get picked are the ones that know who the customer is in between the purchases.

What agents can't get anywhere else is Lived Experience Data: the runs, rides, hikes and races customers choose to share from the wearables and apps they already use. Brands that start building it now head into 2027 ahead.

$3–5T
of global consumer commerce could be mediated by AI agents by 2030.
McKinsey
3×
growth in AI-referred orders to Shopify merchants, year over year.
Shopify, Q2 2026
1
moment. Search, comparison and consideration collapse into a single agent-made decision.
McKinsey
Sources: McKinsey, "The automation curve in agentic commerce"; Shopify, "AI and organic search: Q2 2026 findings."
What you get

A revenue number your CFO can pressure-test.

A ten-page report your leadership team can act on. The revenue model is deliberately conservative: it counts only customers who connect their wearables and apps. Treat the number as your floor.
For your CEO
Where you stand against competitors
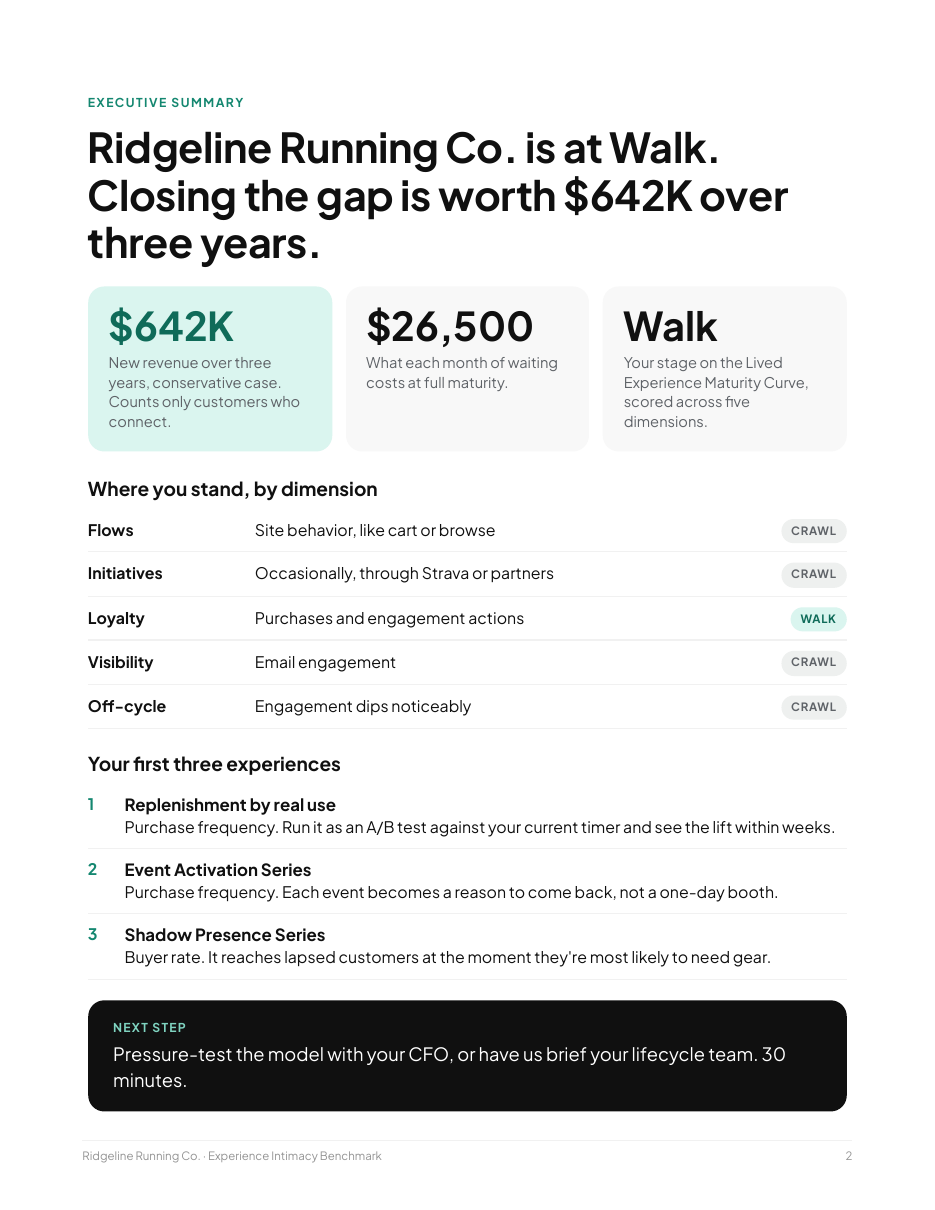
Know where you're ahead before a competitor shows you. A Crawl, Walk or Run score on each dimension against other outdoor, sports and performance brands, with what moves each one up.
For your CFO
What closing the gap is worth
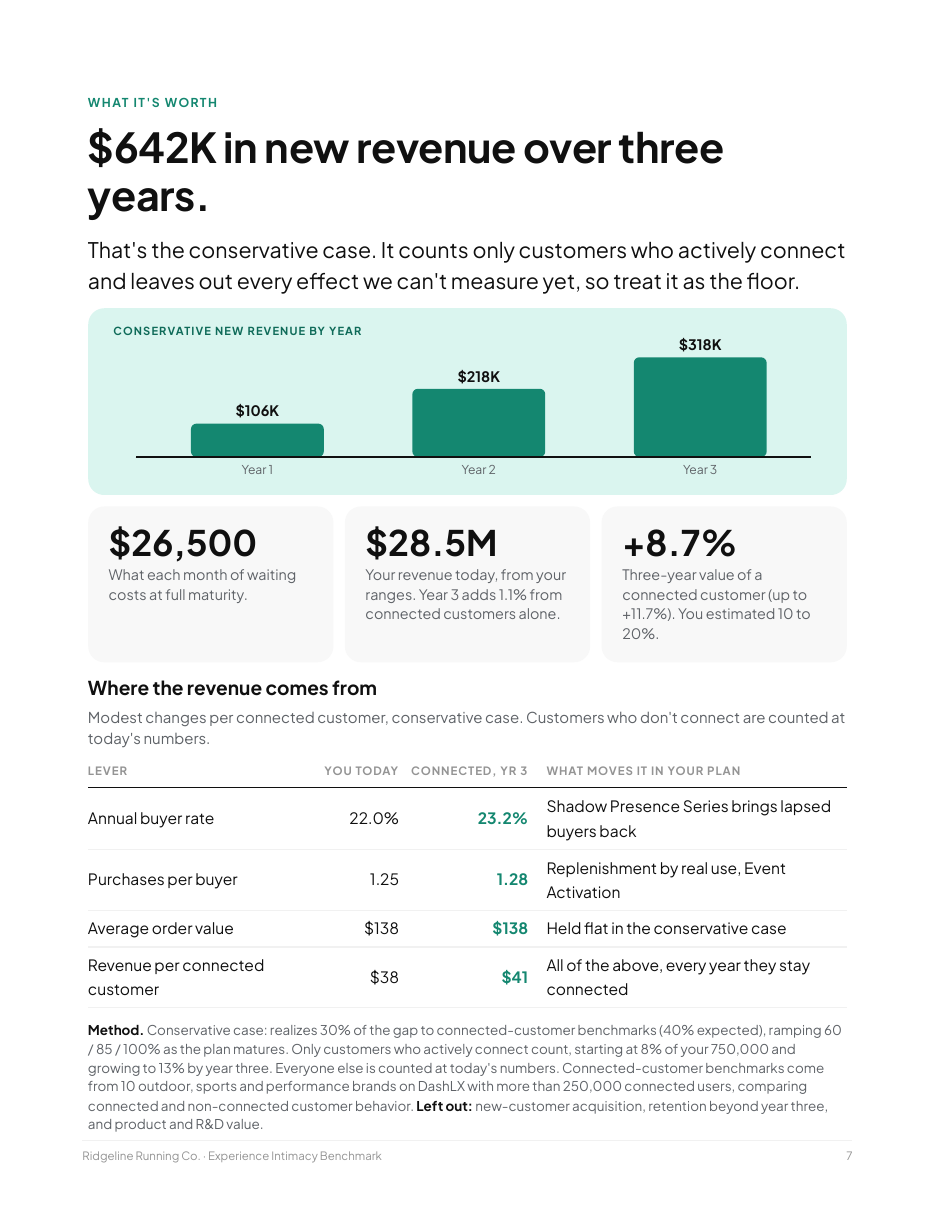
Retention bets are hard to fund without a number. Get new revenue over three years, in conservative and expected cases, built from the ranges you give us and how connected customers buy at brands already on DashLX. Every assumption is shown, plus what each month of waiting costs.
For your CMO and lifecycle lead
Four experiences to close that gap
More relevance without a new stack. Matched to your stage, your stack and the campaigns you run, they work inside the flows you already send, so you can A/B test the first lift within weeks.
Sample report cover: $642K in new revenue over three yearsSample report executive summary: stage and scorecard by dimensionSample report revenue model: new revenue by year

Sample report for a fictional brand, Ridgeline Running Co.

Bring it to your 2027 planning.

What we benchmark

Five dimensions of experience intimacy.

Experience intimacy is how well your brand knows and shows up for what customers live between purchases. Each dimension is scored against competing outdoor, sports and performance brands already on DashLX, so you see where you're ahead and where there's room to grow. Benchmark data comes from those brands and from the responses being collected for the 2027 Lived Experience Benchmark Report.

01 · Flows
What triggers them
Do your cart, browse and win-back flows run on timers, or on what customers actually do?
02 · Initiatives
Challenges and events
Do you give customers something to do between purchases?
03 · Loyalty
What you reward
Purchases only, or the activity that makes someone a customer for life?
04 · Visibility
What you know
Between orders, do you see email opens or real use?
05 · Off-cycle
When campaigns stop
Does the relationship exist when nothing is running?
The Lived Experience Maturity Curve

Three stages to a relationship that compounds.

Stage 1
Crawl
Connected Flows
The flows you already run, made relevant. A cart reminder that knows how they train. Pays back in recovered carts, win-backs and re-buys timed to real use.
Stage 2
Walk
Initiatives
Event series and challenges that count each person's progress. Pays back in more buyers and more frequent purchases around events and seasons.
Stage 3
Run
Programs
An always-on relationship, with loyalty that rewards real activity. Pays back in retention and lifetime value that builds every year.

Brooks Run Club: members who connected vs. members who didn't

+23%
average order value
+77%
email open rate
+333%
click-through rate
DashLX connects the wearables and apps customers already use to the experiences brands send them. Read the Brooks case study
How it works

Ten minutes now. A number for your 2027 plan.

Three steps
  • Answer 22 questions. Ranges are fine: customer base, buyer rate, order frequency, AOV and repeat rate. Answer yourself or forward it to your lifecycle lead.
  • We build and review your report, and email it within one business day.
  • Optional: a 30-minute readout with your CFO or lifecycle team.
How your answers are protected
  • SOC 2 Type II. No customer data, logins or files.
  • Used to build your report, and added anonymously to the 2027 Lived Experience Benchmark Report.
  • Never published by company name or individual figures.
Take the benchmark

See where you stand.

The brands that close the gap won't out-market their competitors. They'll out-know them.

What you get for 10 minutes
  • A custom report within one business day
  • Your stage, your revenue gap, and four experiences to start with
  • No sales deck, no pricing

Every result is labeled as an estimate. The benchmark closes Nov 24 so results make the 2027 report.